

[🔥TRADING] : DAY 10 - half right
[🔥TRADING] : DAY 10 - half right
Bigger loss & it took longer than (not) expected. I explain.

I wrote today our first educational post about indicators. I sent it to you by mistake because I don’t want you to feel overwhelmed with too many publications the same day. Inside the next DAY RECAP, you’ll get the links to the other posts.
👉Portfolio index 89.39
👉Fees paid 0.2460 ETH
👉Total options volume 820
👉Net Profits -0.2210 ETH
👉Current value 1.8627 ETH
👉Days elapsed 10
👉Days remaining 170
👉Daily % to reach target +1.36%
👉Daily % realized -1.11% >> 😯
👉Projected value 0.2658 ETH >> 🥴
👉vs. target 1.33%
Hej here,
Yesterday, DAY 9, Wedn. 3rd 2021 I shared with you the biggest risk I saw and my strategy overnight: a bearish head & shoulders and a potential drop to $ 1’520, however I was sticking to my positive view on ETH (keeping my long call 28MAY21-3000).
What happened today
It took about 9 more hours to complete (it should have been completed in 3 to 4 hours) but the bearish head & shoulders did materialize, as the ETH went as low as $ 1’527 around 10.30 am Paris time. So although I feared that scenario, it was not mine. So today it hurts: -17% unrealized loss (until I do not sell!) on that particular trade, ie -11% since inception. 🤦♂️🤷♂️
One takeaway: why is the pattern completed at $ 1’527 while I was referring to a completion level at $ 1’520? Technical analysis is not a science and most of time there’s an acceptable range of movement & price around a target price, that does not nullify the price action. In other words, there could be approximative figures that still validate a technical analysis scenario.
One key learning: patterns can take longer than expected to form.

Later in the day, the $ 1’600 ETH resistance level to watch out (as mentioned in DAY 9) continued to be very heavy. Any attempt to cross that level and go higher was rejected (with a $20 margin initially then exactly at that level) and this led to more downward pressure on the ETH price.
My strategy overnight going into DAY 11
In my view, if you consider at the same time these three failed attempts today to go above $ 1’600 and the light blue channel that goes south reminds me of a popular bullish pattern called “cup & handle” ☕.
In a nutshell 📍, there is this rounding formation that creates the cup, kind of a half circle THEN there is the handle that starts at the top right border of the cup, slightly going down then bouncing up sharply.
Here is the theoretical 📄 “cup and handle” compared to my sentiment towards current ETH price action ⤵⤵⤵
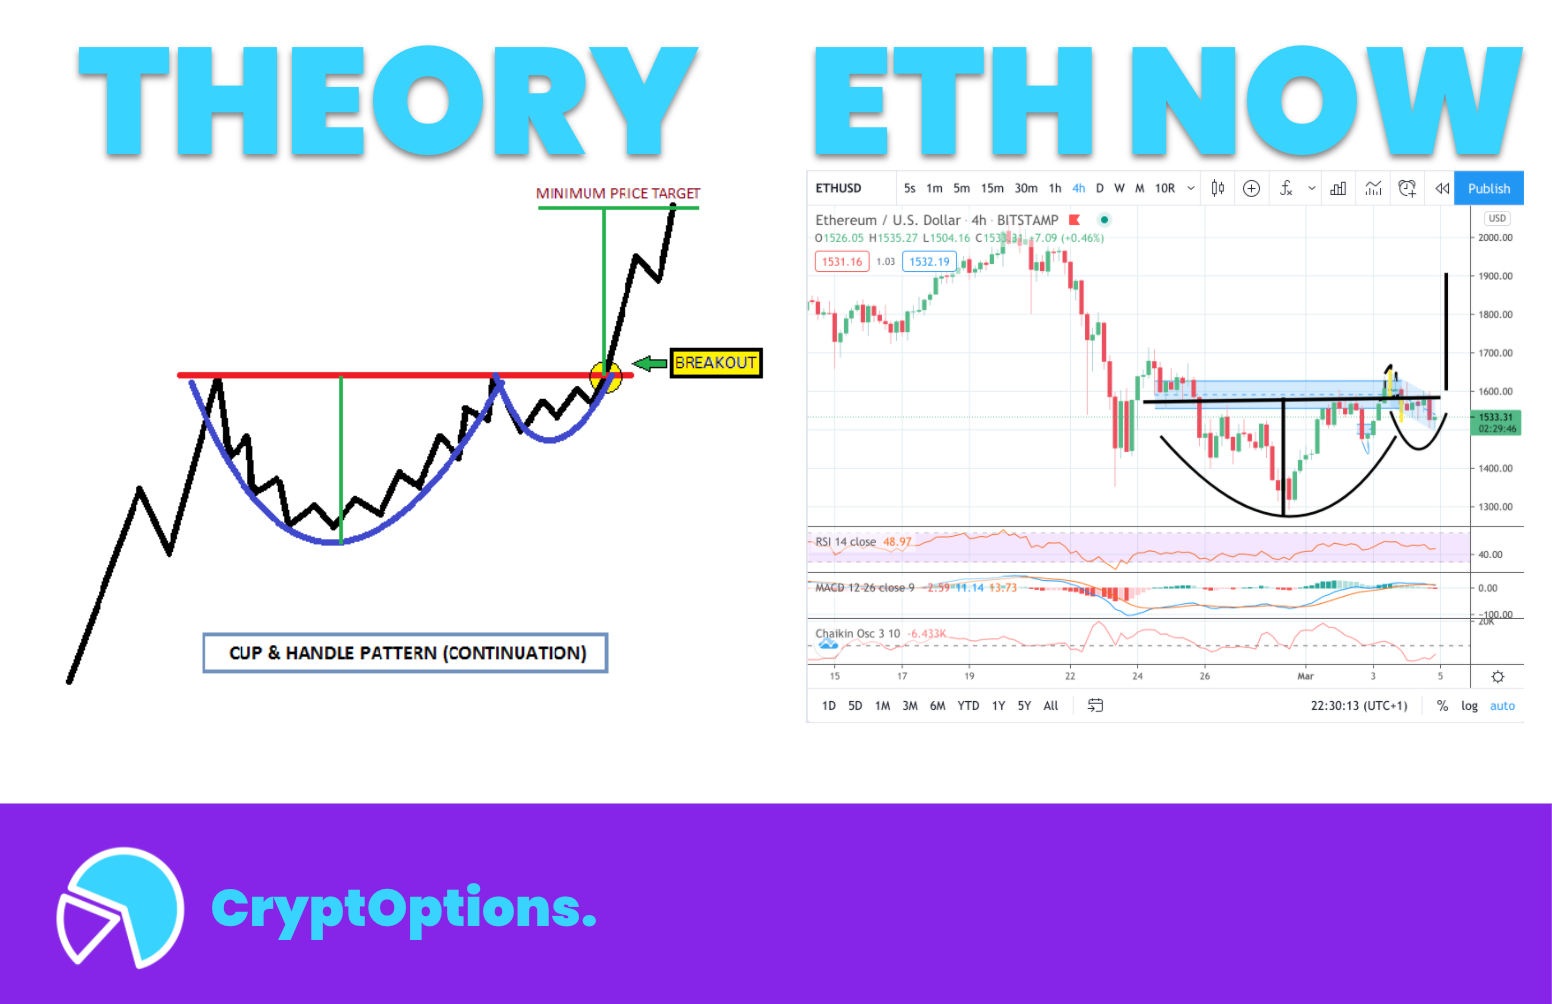
What it means.
ETH can continue ✅ to dip a bit down to $ 1’500 - $ 1’480 through the “handle” and will still validate a potential “cup & handle” bullish (positive) formation.
👉 In such prospects, I keep my long call 28MAY21-3000 because I do believe this formation is very likely to materialize, and I set my ETH price target at $ 1’900 for March 8th, 2021. 📈
My portfolio performance since inception

That’s all for today, take care.
Raph.