

[EDUCATION] : Indicators.
[EDUCATION] : Indicators.
Leading or lagging, momentum or trend, overbought or oversold.

If you’ve already some exposure or advanced exposure to financial markets and charting techniques, I won’t be offensed should you skip this post. Alternatively, you can also read through and share your techniques by commenting this post.
👋 Hello CryptOptioners,
The objective of this post is to be an evergreen post, meaning that I will very oftentimes edit this post to add more information. Each edit will have a manual timestamp, such as EDIT [March 5th, 2021]If you’ve read my recent posts, you have noticed some technical analysis lingo.
Oftentimes, as I’m referring to RSI behing a leading indicator of momentum, or MACD being a lagging indicator of trend 📈📉, I can understand that things can get quickly confusing and overwhelming.
The Good news
Now I’ve got you covered with definitions & theoretical examples. What follows is applicable to any kind of security or asset class that has publicly available price history (stocks, indices, currencies).
And the better news 👉 I am not going to write again what has been written over and over again about technical analysis. My point in this [EDUCATION]al piece is to bring to you my best curation about technical indicators, said to be leading or lagging, momentum or trend.
Let’s start!
Definition of a Technical Analysis Indicator
To be further edited soon.
Past price is an indicator of future performance according to “technicians”. Technical traders believe that current or past price action in the market is the most reliable indicator of future price action 🔎. Technical analysis is not only used by technical traders. Many fundamental traders use fundamental analysis to determine whether to buy into a market, but having made that decision, then use technical analysis to pinpoint good, low-risk buy entry price levels. source
So, an indicator manipulates price data 💻 using a mathematical formula. The indicator shows a visual representation of the mathematical formula and price inputs. source A technical indicator offers a different perspective from which to analyse the share price action. source
Leading or lagging?
To be further edited soon.
A leading indicator: a tool designed to anticipate 🔭 the future direction of a market, in order to enable traders to predict market movements ahead of time. source
These indicators help you profit by predicting what prices will do next. Leading indicators provide greater rewards at the expense of increased risk. They perform best in sideways, trading markets. Leading indicators typically work by measuring how overbought or oversold a share is. This is done on the assumption that a share that is oversold will bounce back. source

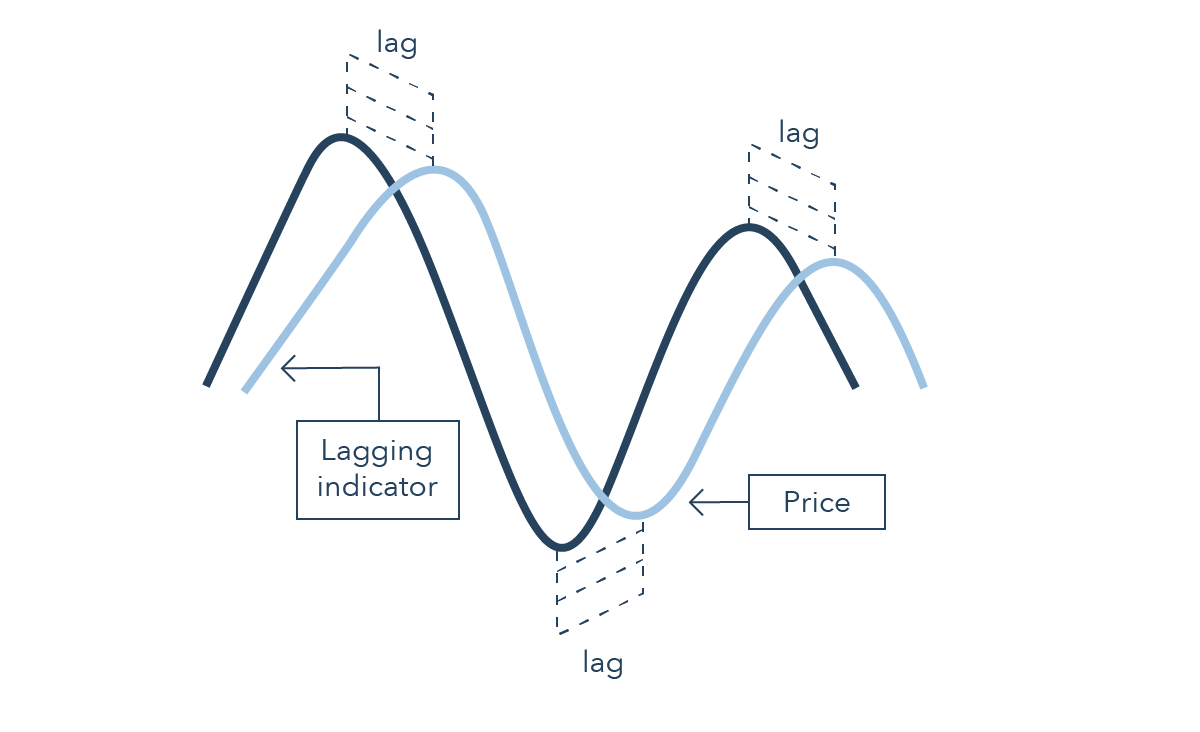
A lagging indicator: a tool that provides delayed 🐢 feedback, which means it gives a signal once the price movement has already passed or is in progress. These are used by traders to confirm the price trend before they enter a trade. source
These indicators are great when prices move in relatively long trends. They do not warn you of upcoming changes in prices, they simply tell you what prices are doing (i.e., rising or falling) so that you can invest accordingly. Trend following indicators have you buy and sell late and, in exchange for missing the early opportunities, they greatly reduce your risk by keeping you on the right side of the market. Trend following indicators do not work well in sideways markets. source
Balancing between leading & lagging indicators: leading indicators react to prices quickly, which can be great for short-term traders, but makes them prone to giving out false signals – these happen when a signal indicates it’s time to enter the market, but the trend promptly reverses. Conversely, lagging indicators are far slower to react, which means that traders would have more accuracy but could be late in entering the market. Relying solely on either could have negative effects on a strategy, which is why many traders will aim to find a balance 🥢 of the two. source
Momentum or Trend?
To be further edited soon.
A momentum indicator: a tool utilized by traders to get a better understanding of the speed 🐆 or rate at which the price of a security changes. Momentum indicators are best used with other indicators and tools because they don’t work to identify the direction of movement, only the timeframe in which the price change is occurring. source
A trend indicator: measure the direction and strength 🐘 of a trend by comparing prices to an established baseline. source
Overbought / Oversold? The case of “Oscillators”.
To be edited soon.
That’s all for today, speak soon.
Raph.